Schema Diagrams
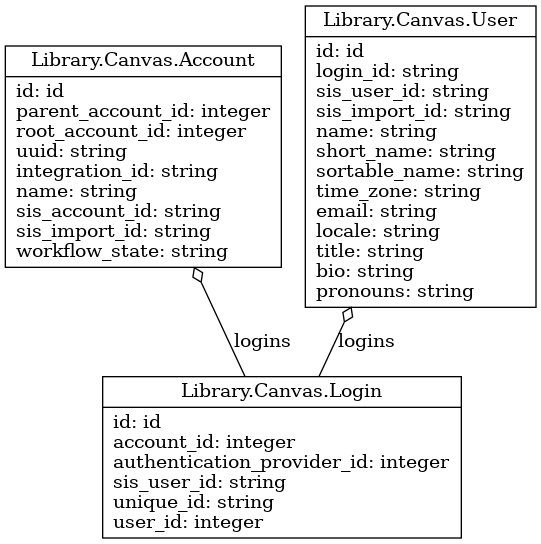
Z uses the Ecto Dot library to semi-automatically generate schema diagrams for various sub-systems. For decent examples, see Library.Google.Geocode or Library.Canvas.
Generating Diagrams
To generate diagrams, look for the generate_group_diagrams and generate_module_diagrams functions in the root-level mix.exs.
Group diagrams are diagrams that need a bit of hand-holding to generate properly. Since the diagramming system only goes top-down (via has_one, has_many, and embeds and embeds_many relationships), in some situations you just need to feed the diagrammer a few modules to generate the whole diagram.
Module diagrams are the simpler variant - modules or groups of modules whose schemas are able to be automatically generated because the table structure is linear.
The write_all_schemas function simply looks at svg files that have already been generated and uses those to automaticaly generate the All Schemas guide. For this reason, that guide will always be behind if a new set of schemas get deployed to the docs. Oh well...
File Types
Each generated diagram will create pdf, png, svg, and dot variants. Typically we only reference the svg variant in our inline documentation, but the other files are available for reference or download as-needed.
For example:
 |
| 
All generated files get the fully-qualified name of their module. So, for example Z.Schema.Address generates four files named Elixir.Z.Schema.Address.{pdf,png,dot,svg}.
Documenting Diagrams
Simply use Utility.Documentation.schema_diagram/1 like so in your documentation:
#{Utility.Documentation.schema_diagram(__MODULE__)}